Statistic tables for sub networks and sites
The create subnetwork tool can generate optional tables that provide metrics on the subnetworks and sites used to created them. Such metrics can be used to understand network fragmentation and provide you the information to help identify and prioritise the removal of significant barriers to fish movement within the wider river network.
This page uses a simple example to help explain the metrics reported by the tool. Below you see the main output of the tool, a river network cut into two subnetworks by the barrier site labelled as number 953. This example is a filtered output of a processing from a much larger network with a thousand barriers, hence the large ID numbers given to the upstream (brown) and downstream (green) subnetworks.
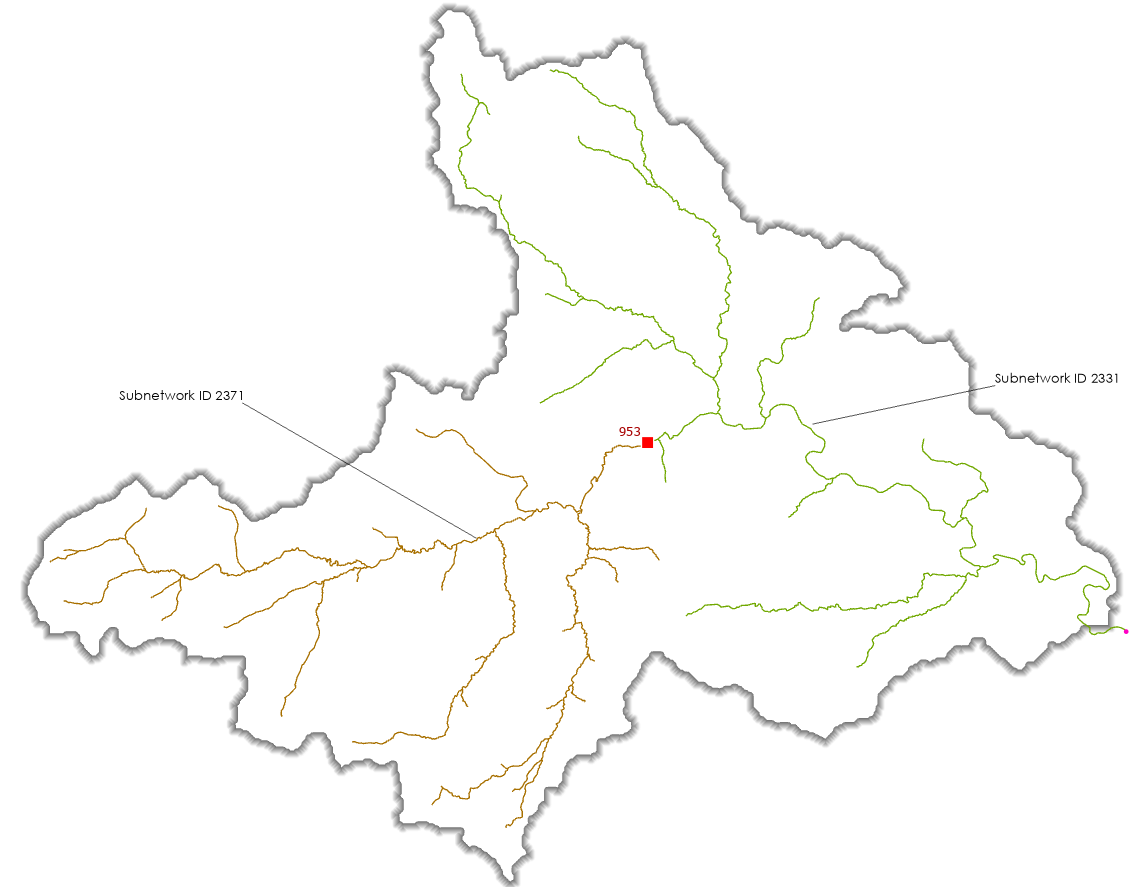
The Create subnetwork from sites tool can create 3 optional tables and these are discussed below using realistic values.
Network Statistics (_NetStats)
In this example the table would contain the following values:
|
SubNetID |
SubNetLen |
|
2331 |
82249.87 |
|
2371 |
79750.17 |
SubNetLen is the sum of the polyline lengths for the subnetwork. This will be in the units of coordinate system, in this case metres.
Site Statistics (_SiteStats)
In this example the table provides subnetwork metrics linked to the barrier site in question.
|
SiteID |
US_SubNetID |
US_SubNetLen |
DS_SubNetID |
DS_SubNetLen |
SubNet_Ratio |
TotalLen |
MinSubNetLen |
RelSubNetGain |
ReleasedNetLen |
ReleasedBarrierSeq |
RelBarrierSeqCount |
RelNetCatchProp |
|
953 |
2371 |
79750.17 |
2331 |
82249.87 |
0.969609 |
162000.05 |
79750.17 |
0.492284 |
162000.05 |
953 |
1 |
1 |
US_SubNetID and US_SubNetLen are the upstream subnetwork ID and its total length and you can clearly see these match what is found in the Network Statistics table. Conversely you have the downstream subnetwork ID and length (DS_SubNetID and DS_SubNetLen).
SubNet_Ratio is the upstream length divided by the downstream length (US_SubNetLen / DS_SubNetLen). A value of 1 would indicate the upstream and downstream subnetworks have exactly the same sum lengths (US_SubNetLen = DS_SubNetLen). A ratio value greater than 1 indicates the upstream subnetwork is larger than the downstream subnetwork. A ratio less than 1 indicates the downstream subnetwork is larger than the upstream subnetwork.
TotalLen is the combined lengths of the upstream and downstream subnetworks (US_SubNetLen + DS_SubNetLen). This provides you with a total connected network length if the barrier was to be removed.
MinSubNetLen is the minimum length gained of the two subnetworks. In this case the smaller of the two subnetworks is the upstream network 2371 with 79750.17m and this is what MinSubNetLen is set to. If MinSubNetLen was zero, this indicates the barrier was placed at a source or mouth node and there was no subnetwork.
RelSubNetGain is the minimum divided by the total (MinSubNetLen / TotalLen) and in this case is 0.492. This metric ranges from 0 to 0.5 A zero for this metric indicates the barrier was on a source or mouth node. A value of 0.5 indicates the upstream and downstream subnetworks were exactly the same length. All other values between this range give you an indication of the relative contribution the smaller subnetwork is for the combined channel lengths (TotalLen). Thus a value tending towards zero would indicate the majority of the rivers connectivity remains unchanged. As the value tends towards 0.5 the connectivity of the network is more impacted and reaching a value of 0.5 means the network has been halved with no dominant subnetwork.
ReleasedNetLen is the total length that becomes connected when the barrier and all its downstream barriers on the route to the network mouth are considered removed. There might be many reasons why a barrier cannot be removed but this metric indicates in an ideal world with unlimited resources and no impacts to habitat or objections from the community what could be achieved if there was a concerted effort to connect the network to the sea.
ReleasedBarrierSeq is a text field containing a comma separated sequence of barrier ID's used to compute the ReleasedNetLen. These ID's are in the sequence as the barriers are visited on the route to network mouth.
RelBarrierSeqCount is the number of barriers identified to create the released network length. This is simply a count on the number of ID's in ReleasedBarrierSeq.
RelNetCatchProp is ReleasedNetLen divided by the original catchment network length as defined by the encoding of catchment ID by RivEX. This creates a proportion value. A value of 1 indicates the released network is the same as the original catchment size. In this case the removal of the barrier and all its downstream barriers has completely opened the entire network up to full connectivity. A value very close to zero would signify that the released network although provides connectivity to the river mouth it is just a fraction of a much larger catchment. The further upstream a barrier is in its catchment the large the released network becomes and therefore you would expect RelNetCatchProp to increase too.
See a worked example below, of how the 3 released network fields (ReleasedNetLen, ReleasedBarrierSeq & RelBarrierSeqCount ) are computed.
Catchment Proportion Statistics (_PropCatchStats)
In this example the table provides a comparison of the original catchment against the newly created subnetwork.
|
CatchID |
SubNetID |
SubNetLen |
CatchLen |
SubNetProp |
|
100 |
2331 |
82249.87 |
162000.05 |
0.507715 |
|
100 |
2371 |
79750.17 |
162000.05 |
0.492285 |
The CatchID field is the original RivEX catchment ID encoded into the river network. A catchment are all connected polylines that drain to a mouth at the sea. This is the pink node in the above image. In this example this catchment happened to be labelled as number 100.
SubNetID and SubNetLen are the subnetwork ID and total length; you can clearly see these match what is found in the Network Statistics table.
CatchLen is the total length of polylines for the original catchment (#100) before it was cut up to create the subnetworks. In this case it is 162000m.
SubNetProp is the Subnetwork length divided by the original catchment length (SubNetLen / CatchLen). This ratio value indicates how much of the original catchment (the entire network that drains to a mouth) the subnetwork is. A value of 1 would indicate the subnetwork is the catchment, i.e. there were no sites snapped to the original catchment. A value of 0.5 would indicate the sum length of lines making up the subnetwork is 50% of the original catchment size. A value of 0.01 would indicate the subnetwork is 1% of the original catchment size. Similar to the RelSubNetGain field in the Site Statistics table this metric helps you understand the impact on connectivity the subnetwork is having on the wider catchment. If there had been 3 barriers within this catchment then 4 subnetworks would have been created with their SubNetProp summing to 1. Sorting on such a field would allow you to identify the subnetwork that is already the largest connected section of the network.
A worked example of how the released network values are computed
This example shows how fictitious barriers within the River Dee (Scotland) fragment the network and the released network lengths computed for some example barriers. The image below shows the downstream section of the Dee with subnetworks coloured by their subnetwork ID and barriers (green points) labelled with their ID.
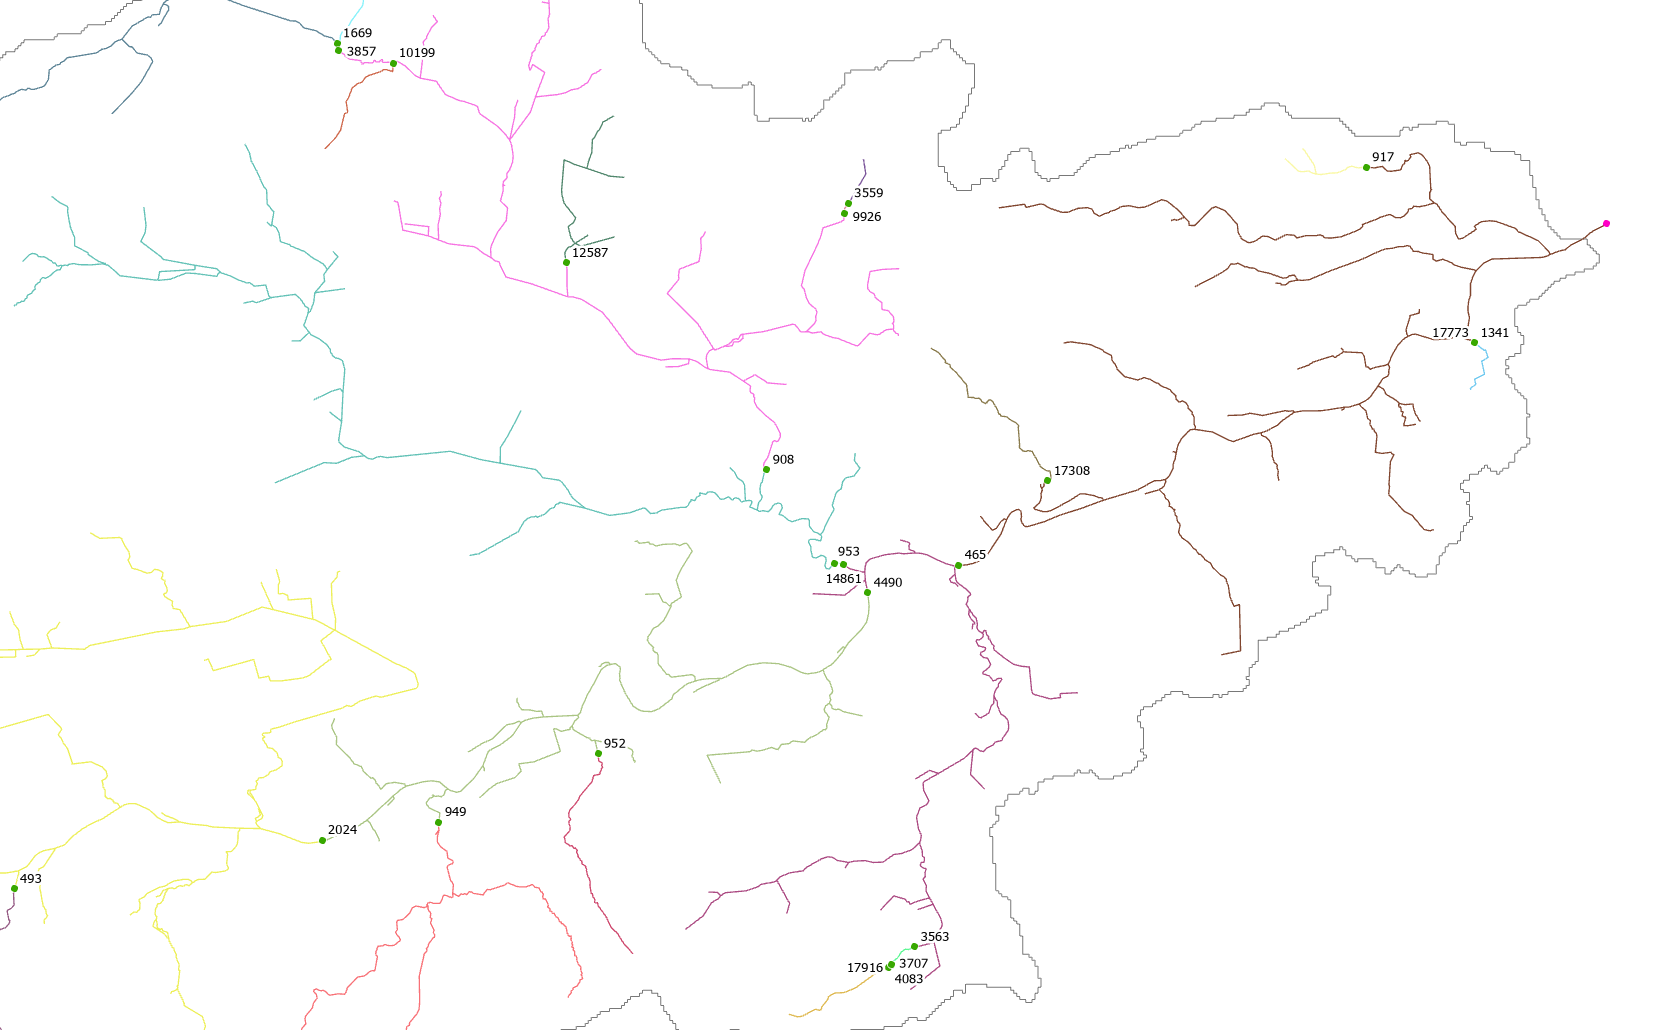
Take barrier 908 (approximately middle of image), to reach the river mouth (purple node) you need to pass through 953, 14861 and 465. If those barriers are removed along with 908, then 4 barriers are removed, creating150Km of connected channels (the released network).
The image below shows the subnetworks selected that create the released network. Note the released network terminates at barriers upstream of site 908 and at barriers within other sub-catchments (e.g 17308) which were not on the route to river mouth.
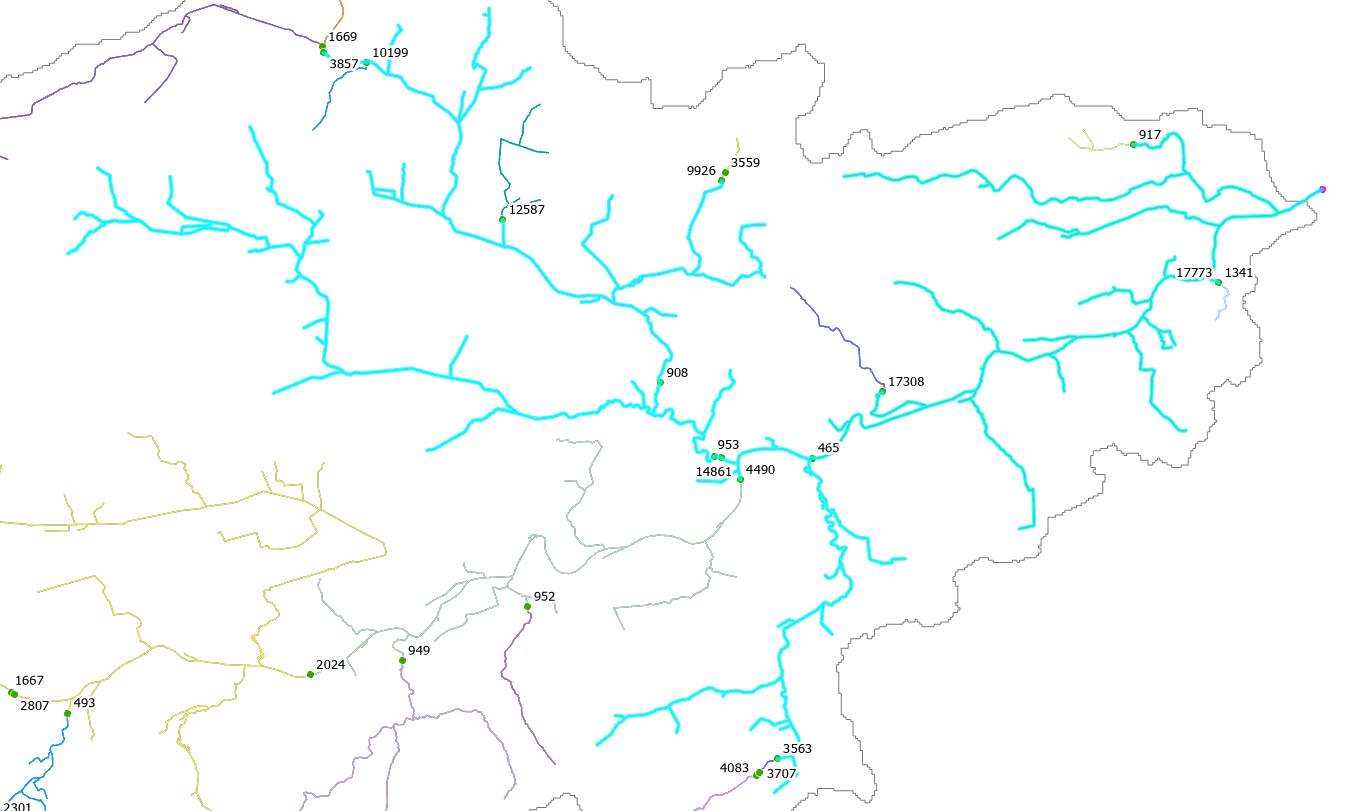
Barrier 493 in bottom left of image is similarly a 4 barrier removal to create its released network. You would remove 493, 2024, 4490 and 465. This would create a released network of 163Km.
Below is the site statistics table for this fictitious data with the two mentioned barriers highlighted. Such information can help you prioritise barrier removal.
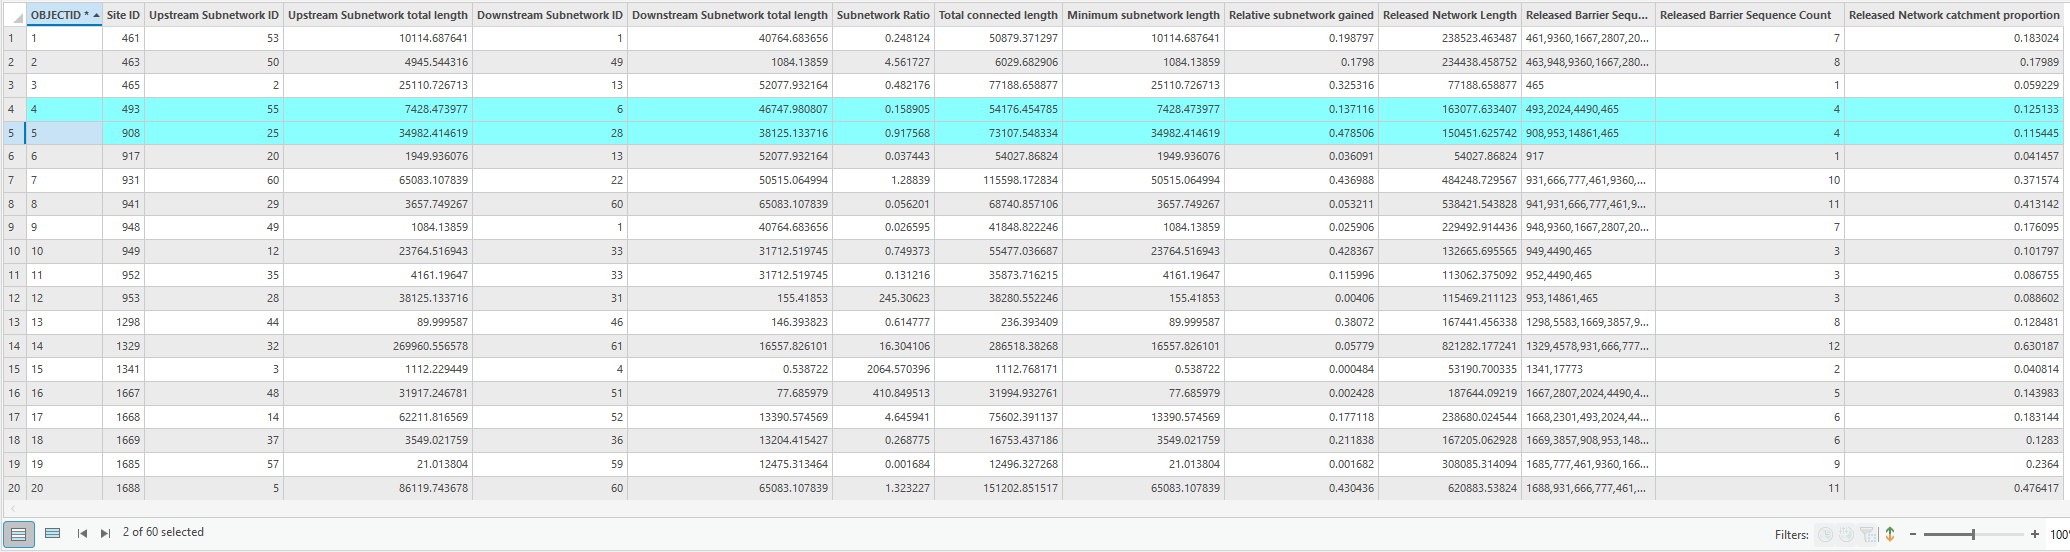
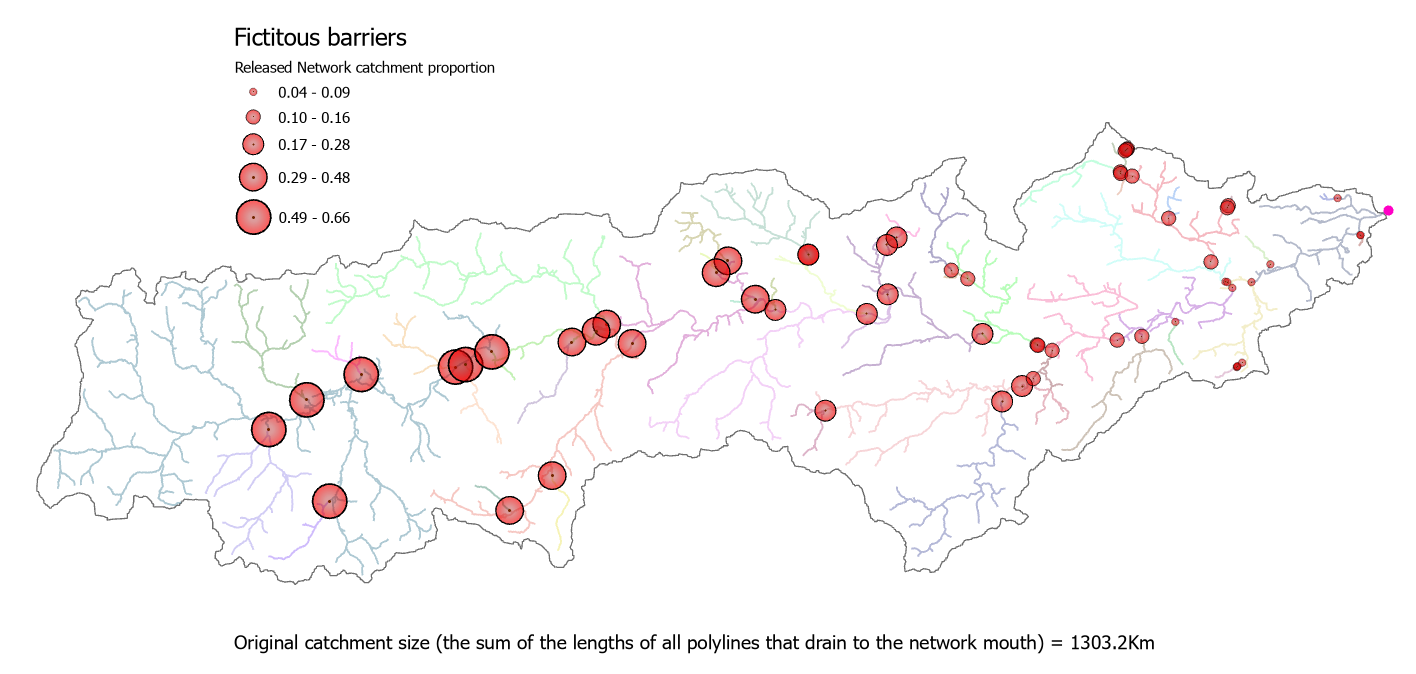
The table could even be joined back to the site layer based upon the SiteID field and the data visualised using the metrics. In the image below the site statistic table has been joined to the original barrier data and the released network catchment proportion visualised as graduated symbols. The released network catchment proportion is the released network for the barrier divided by the original catchment size (the sum of all polyline lengths connected and draining the mouth outlet), in this example it is 1303.2Km. Taking the two extremes, a barrier close to the network mouth has a release network that is only 4% of original catchment whilst a barrier in the upper reaches of the Dee would connect 66% of the original catchment if its release network could be created. These are ideal scenarios, naturally there may be many reasons why some downstream barriers could not be removed. RivEX provides you the data to help you prioritise barrier removal.