Example - Identifying downstream structures that would affect catadromous species
Scenario
You are a fish biologist and interested in catadromous species. You have obtained a point dataset, identifying in-channel structures. You want to count the number of structures a fish would need to pass to reach the sea as well as understanding the distances these structures are from the river mouth.
 The following guide is using a fictitious set of points and is in no way representing known fish sites or in-channel structures...
Workflow
|
Step |
Processing Task |
||||||||
|
1 |
You have prepared your river network and added the required attribution to the network so you can use the Find downstream sites tool. How do you know which attributes you need to add to the network so this tool will function? The answer is in the help file, under the usage section. You need to have attributed your river network with Catchment ID, Source ID and Distance to mouth. |
||||||||
|
2 |
Your fish site data are points that you created and snapped to the river network. You know they are on the river polylines and the dataset has a unique numeric ID field and is in the same coordinate system as the river network. |
||||||||
|
3 |
The barrier dataset was provided to you by a government agency. The sites were provided in the WGS84 coordinate system. You need to project the barrier data into the coordinate system that the river network is in. |
||||||||
|
4 |
It is unlikely the projected barriers dataset will be aligned to the river network; you need to run the snap sites to network tool. It will be the snapped data you will work with.
|
||||||||
|
5 |
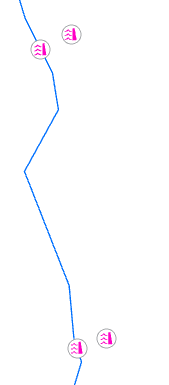
The fish sites mapped along with the snapped barriers.
|
||||||||
|
6 |
The Find downstream sites tool is completed as shown below, note the optional parameter add attribute index has been ticked on to index the site ID field in the output table, we did this as we plan to join data to the table in further analysis. Output is written to the Sites GeoDatabase.
|
||||||||
|
7 |
Understanding the output, field names are described here:
Taking Fish Survey Site 4 as way of example we see that the barriers are encountered in the sequence of 6 > 5 > 4 > 1 > 2 which we can confirm visually in the image to the right. Thus a catadromous fish species would need to navigate 5 barriers in total to reach the sea. The field DSSite_D2M is the distance to network mouth for the barrier. Site 4 is 17.389Km from the network mouth. |
||||||||
|
|
The find downstream sites tool returns the sites as they are visited in a downstream traverse to the river mouth, this would only be sensible if the data was snapped to the network otherwise non-intersecting sites are dropped from the analysis. You could further enhance your analysis by joining back the type of barrier and computing a passibility score to help you identify sections of channels that would be problematic and candidates for barrier removal. |