Example - Quantify the fragmentation of a river network from in-channel barriers
Scenario
In the past little concern was given to the impact on fish species when a in-channel structure such as a weir/sluice/dam was installed to control flow. As a river ecologist you are interested in improving the connectivity of rivers through the removal of existing barriers. Some barriers, if removed, would reconnect large sections of network whilst others will have less of an impact in reducing habitat fragmentation. As a first step to answering these questions you need understand the fragmentation of the network by the current barrier configuration.
 The following guide is using a fictitious set of points and is in no way representing known barriers ...
Workflow
|
Step |
Processing Task |
|
1 |
You have prepared your river network and added the required attribution to the network so you can use the Create subnetworks from sites tool. How do you know which attributes you need to add to the network so this tool will function? The answer is in the help file, under the usage section. You need to have attributed your river network with Catchment ID. |
|
2 |
Reading the usage section of this tool identifies an important limitation to this tool, the river network must be single-threaded, it cannot have loops. This ensures that the sub-networks are generated correctly. A technique to bulk remove loops from a network is to use Shreve order. |
|
3 |
The barrier dataset you have is in the same coordinate system as the river network, has a unique numeric ID field and are snapped to the network. Barriers that do not intersect the network won't participate in the computation of the sub-networks and will result in an over-estimation in connectivity. |
|
4 |
8 barriers are shown below, they are points that have already been snapped to the network.
|
|
5 |
The Create subnetworks from sites tool is completed as shown below, note the optional parameters for creating the two statistic tables have been turned on. Output will be a new network called subnet along with two tables. Output is written to the Network GeoDatabase.
|
|
6 |
The network colour coded up be SubNetID. Each SubNetID represents a connected fragment of network, this could be thought of as the extent of network a fish could swim within before being blocked by a barrier or terminating at a source.
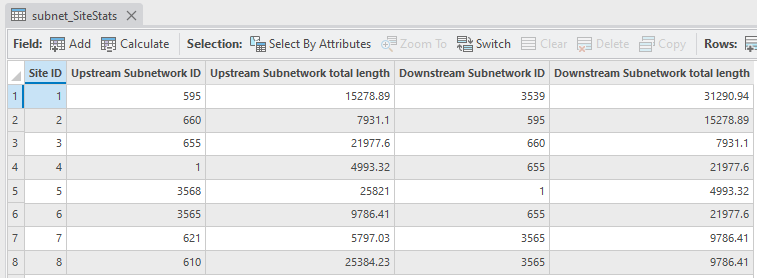
The sub-network site statistics table shows for each site the upstream and downstream network by ID and accumulative length.
Removing barrier 8 would re-connect 25.3Km in a upstream direction, whilst removing barrier 1 would re-connect 31.2Km in a downstream direction yet only re-connect 15.2Km in an upstream direction. Such information will help you prioritise barrier removal. |
|
|
Ranking barriers on their current fish-passibility then excluding the passable barriers would allow you to re-run the tool with a different configuration resulting in different sub-networks. |