Example - Linking salmon redds to weirs
Scenario
You are a fish biologist studying the location of salmon spawning sites (redds). Are the locations of redds influence by the proximity of weirs? To answer that question a key metric is distance to weir. Weirs could be upstream or downstream of a redd. You can use the link sites tool to answer this question, the output being a polyline for each pair of redd-weirs that can be connected.
 The following guide is using a fictitious set of points and is in no way representing known barriers or redds...
Workflow
|
Step |
Processing Task |
||||
|
1 |
You have prepared your river network and added the required attribution to the network so you can use the Link sites tool. How do you know which attributes you need to add to the network so this tool will function? The answer is in the help file, under the usage section. You need to have attributed your river network with Catchment ID. |
||||
|
2 |
It is highly likely that your redds data was collected using a GPS. You need to convert that data into a spatial dataset such as File GeoDatabase point Feature Class. It must:
Avoid using shapefiles these are an old data format with limitations. |
||||
|
3 |
Your barrier data will likely come from another organisation such as your local\national government agency or even from an organisation that collects such data such as amber in the EU. Like the redd sites, your barrier dataset will require some initial setup. It must:
Avoid using shapefiles these are an old data format with limitations. |
||||
|
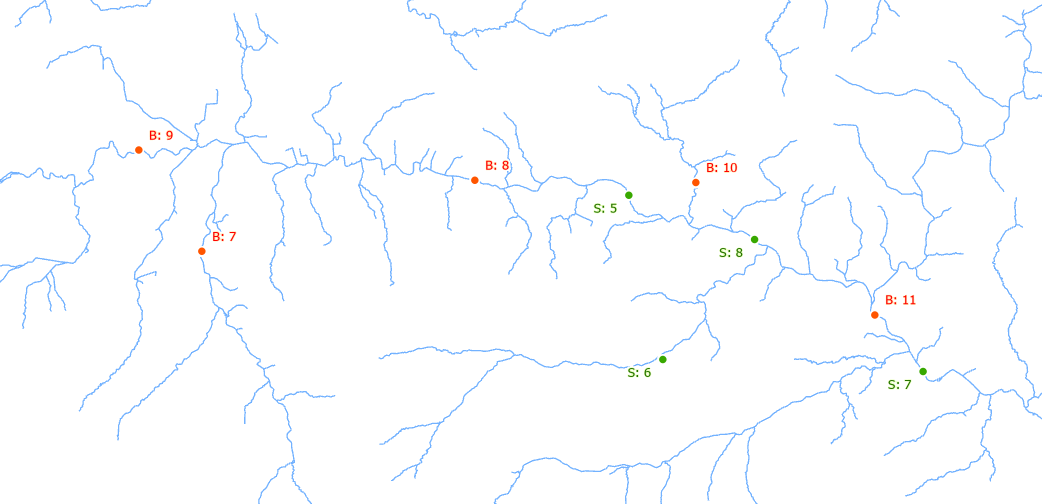
4 |
Your input data would look similar to below, 4 redds sites (green) and 5 weirs (orange). Both site layers should have been snapped to the network and are in the same coordinate system as the river network.
|
||||
|
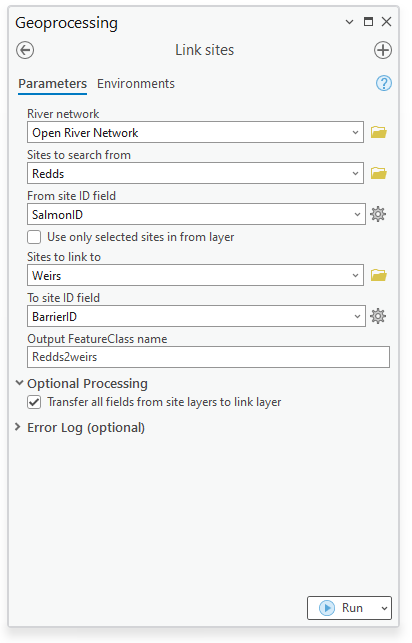
5 |
With the network and datasets prepared you can run the link sites tool. Below we are searching FROM the redds TO the weirs and transferring useful site information to the links.
|
||||
|
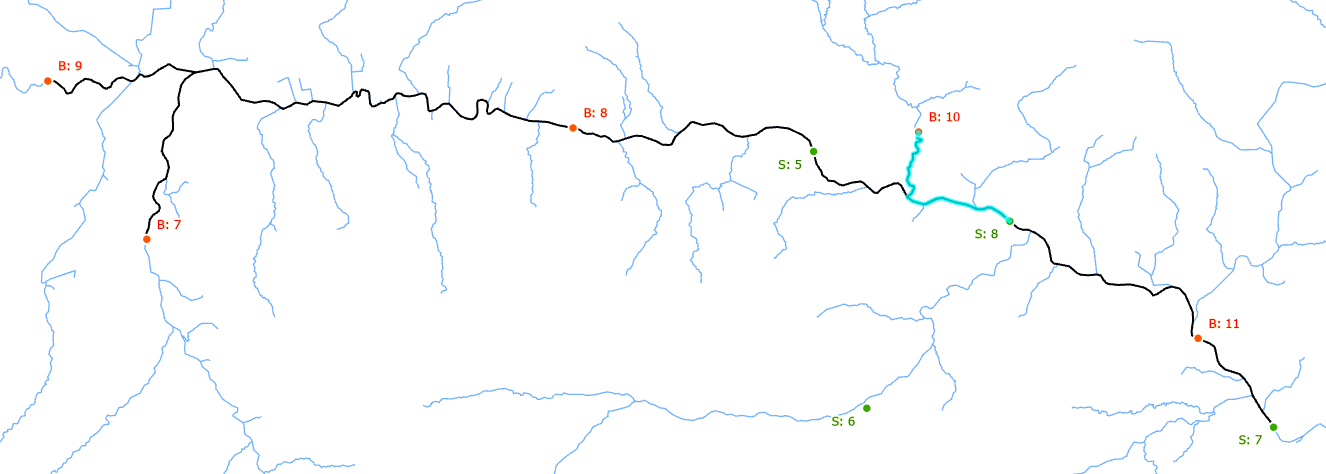
6 |
The output is shown below.
|
||||
|
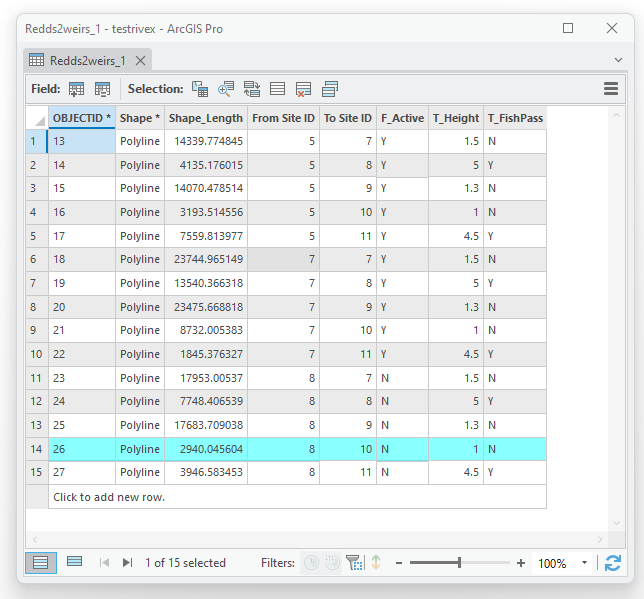
|
The output of this tool not only provides you the distance between sites but also a geometry that you could use in further analysis. You could use the polyline in further spatial analysis (e.g. buffering and selecting up riparian habitat) or simply to visualise the route taken between two locations. In this worked example we looked at fish vs barriers but these points could represent invertebrate sampling locations, infrastructure, geomorphological features, pollution events, invasive species, woody debris to name but a few! |