Example - Convert a CSV/Excel file into a point dataset ready to be used by RivEX
Scenario
You have been provided a dataset that represents point locations on the river network. For example they could represent barriers to fish, survey sites, chemical monitoring sites, outflows, sediment deposits or locations of invasive species. If they have been provided as a spatial dataset (e.g. shapefile, File geodatabase or geopackage) then you need only check if they are in the same coordinate system as your river network before you snap the data to the network. But what if you have been provided is a CSV file or an extract written to an Excel file? What do you do if some of the data has missing values, and how do you ultimately convert the data into a spatial dataset that RivEX can use?
This page steps you through the workflow on how to convert a CSV into a point dataset and highlights issues you may need to resolve.
 The following guide is using a fictitious set of points that represent fish barriers
Workflow
|
Step |
Processing Task |
|
1 |
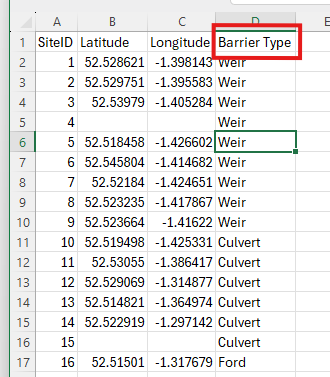
You have been provided a CSV file of barriers in a catchment, open it in Microsoft Excel to check its contents; you may need to correct some issues.
A CSV opened in Microsoft Excel IMPORTANT THINGS TO NOTE:
|
|
2 |
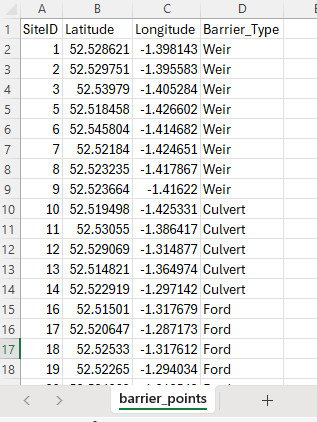
The field header has been corrected, sites with no coordinates have been removed and the Excel sheet has been given a sensible name. The data is saved as an Excel workbook. This worksheet is now ready to be added to the Map in ArcPro.
A corrected CSV saved to an Excel Workbook |
|
3 |
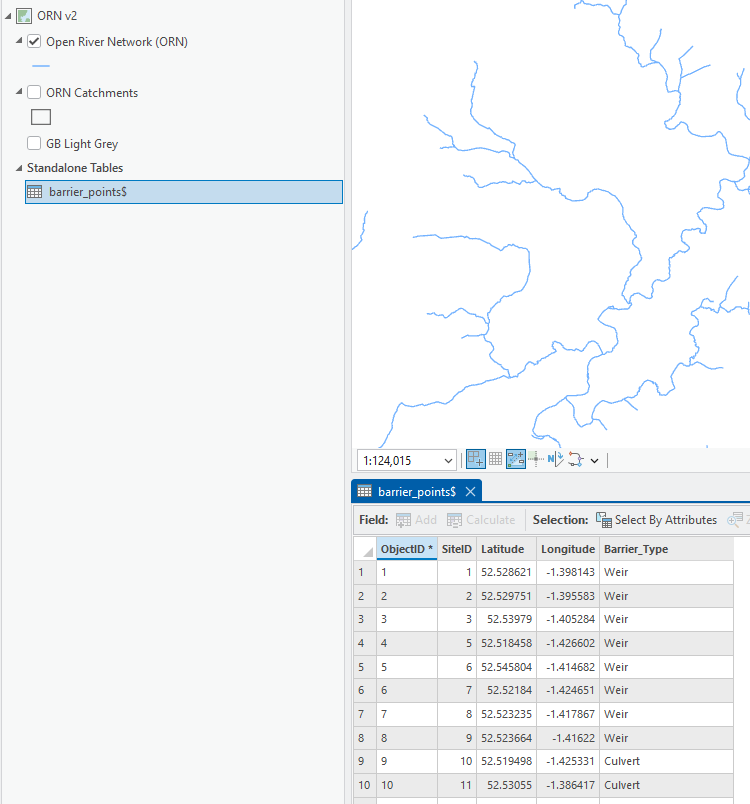
With ArcPro open and a map loaded with a prepared river network; use the Add data button to navigate into the Excel workbook and add the worksheet (in this example it is called barrier_points$). This will add the Worksheet as a Standalone table to the map. Right click on the Table and choose Open to view the table.
The barrier_points$ Excel worksheet viewed from within ArcPro as a standalone table. |
|
4 |
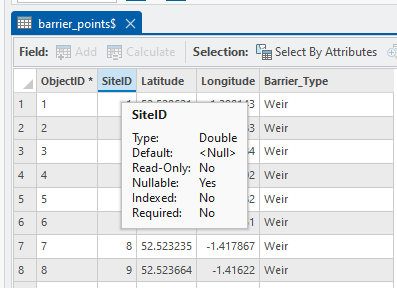
If you hover your cursor over the SiteID header as shown below, it will show you some field properties. Although SiteID is containing whole numbers the field type is DOUBLE. This is not an INTEGER and will be corrected in the next step. How long is the text field "Barrier_Type"? Does it need to be that length?
Check the field types that ArcPro is using for the Excel worksheet, they are not always appropriate. |
|
5 |
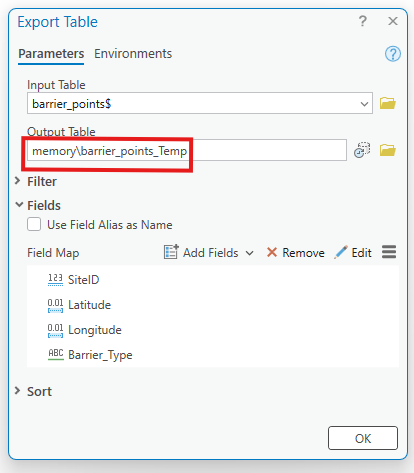
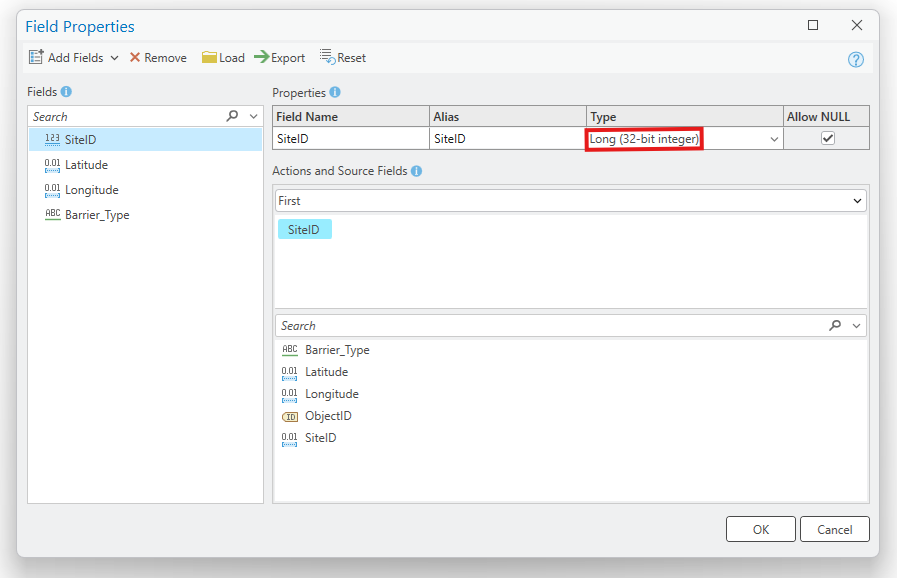
Before you convert the table into a spatial dataset, you need to ensure that the SiteID is type LONG, optionally you could reduce any text field lengths to something sensible. You do this by exporting the table to a temporary in-memory location. Right click on the table in the Contents pane and choose Data > Export Table. Complete the tool as below and run to create a temporary version of the table.
Export table to the in-memory location.
The field map has been used to set SiteID to LONG and reduce Barrier_Type to 50 characters. |
|
6 |
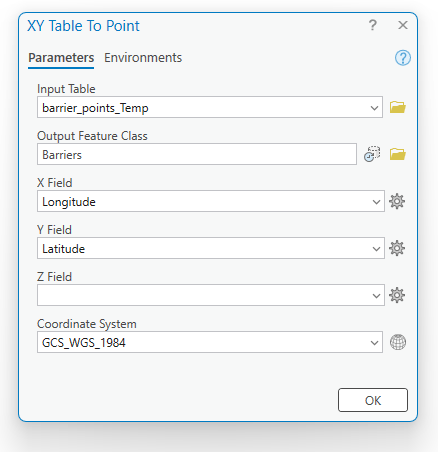
You will now convert the temporary in-memory table to a proper spatial dataset. Remember the coordinates of this example data were provided in Latitude/Longitude and therefore the native coordinate system will be WGS84. If your data had been provided with coordinates in metres/feet then it would be reasonable to assume that the coordinates will be the same as your river network. You can grab the coordinate system of your river network by choosing the river layer in the Coordinate System parameter. Right click on the temporary table in the Contents Pane and choose Create points from table > XY table to Point; complete as shown below and run the tool.
Make sure you choose the correct coordinate system and set the output Feature Class to something sensible. |
|
7 |
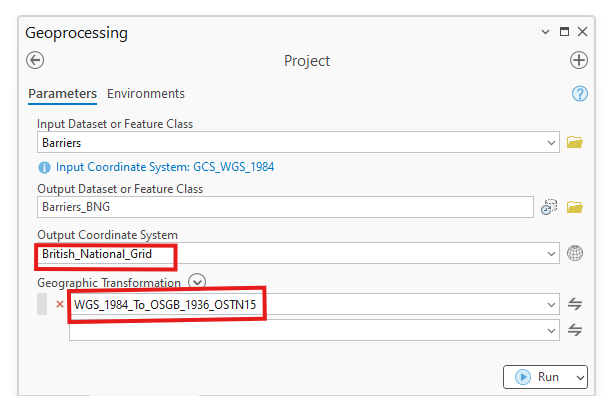
Depending upon the native coordinate system of the point data, you may need to project the data into the coordinate system of the river network. You would typically do this extra step if the data was in WGS84. As this example dataset was in WGS84 we run the project tool as shown below. This example is using a UK river network and for the UK the projected system is the British National Grid. Further advice on projections is provided on this trouble shooting page. Go to the Analysis tab > Tools > In the geoprocessing pane go to Toolboxes > Data management > Projections and transformations > Project.
If your point data was in WGS84 you will need to project it into the coordinate system of the river network. In this example the river network was in British National Grid. Refer to your national coordinate system and appropriate transformation, ArcPro typically picks the most recent transformation which is generally the most accurate.
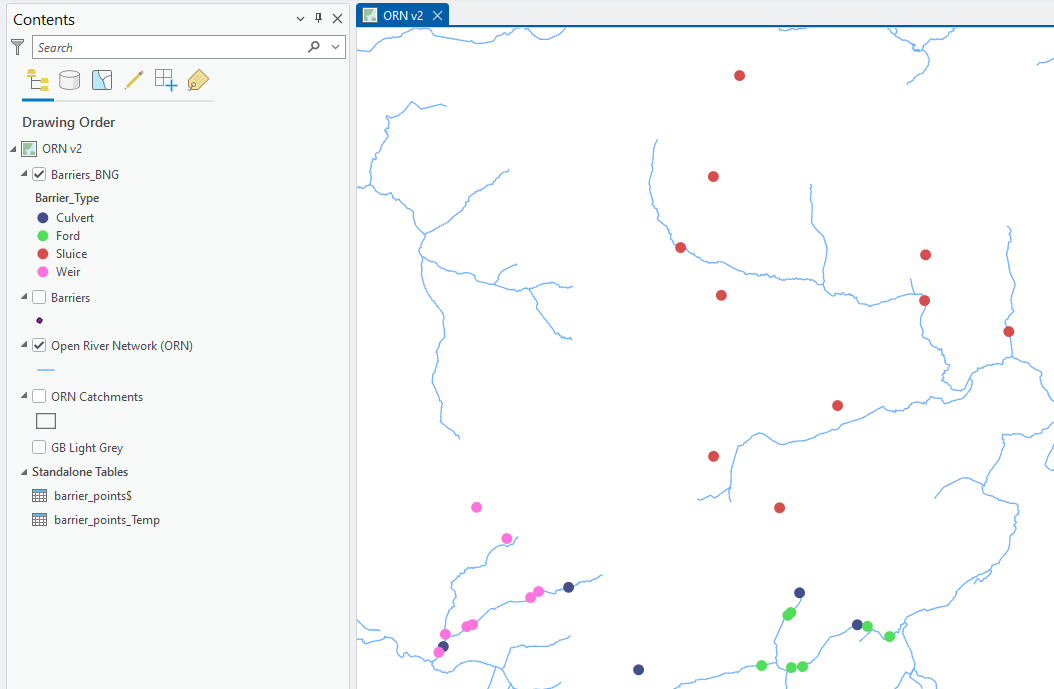
The projected data (this is in the same coordinate system as the river network) symbolised by barrier type. The barriers far from the network may be positional errors or were captured to a higher detailed river network. |
|
8 |
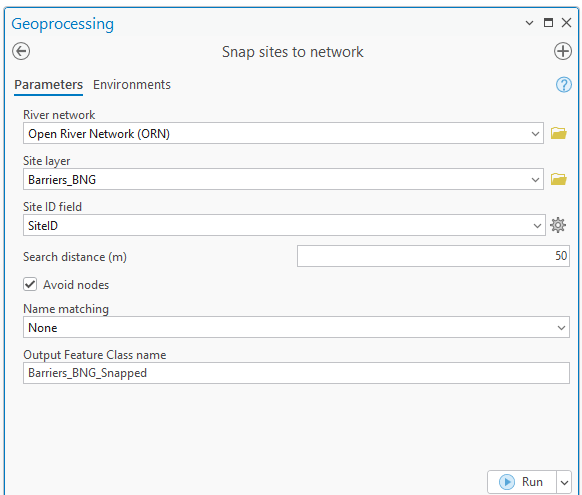
The final preparation step is to snap the points to the network and you can use the RivEX snap sites to network tool. This is completed below, using a simple 50m proximity snap as the site data did not come with any river name fields that could have provided a better quality snap.
Snapping the projected barrier data using a 50m search distance to the river network.
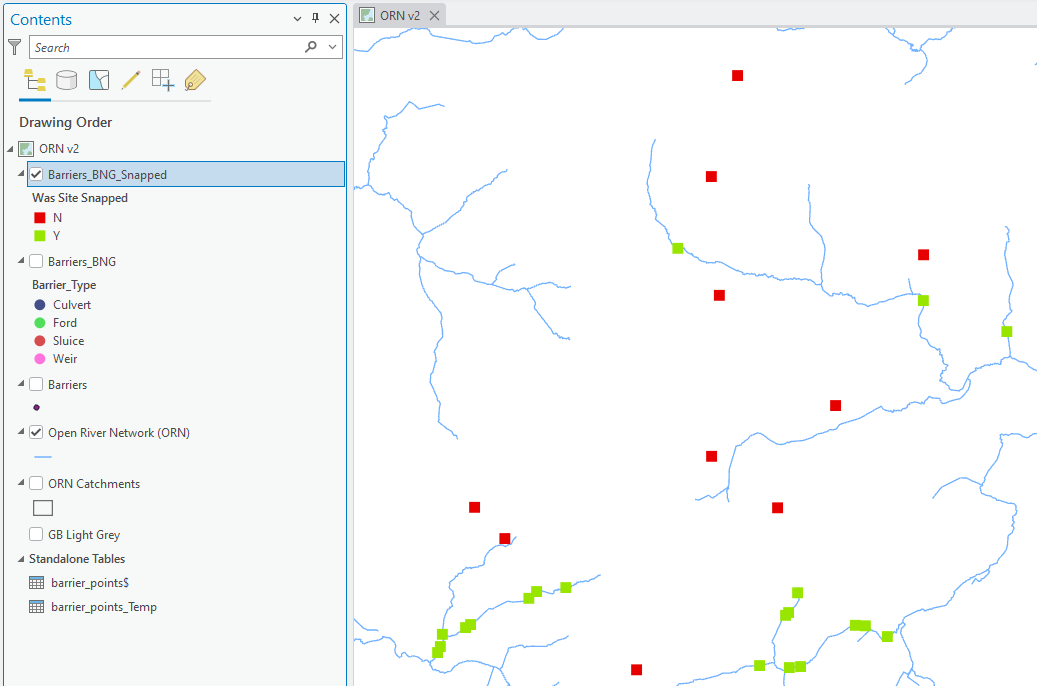
The snapped barrier data symbolised by the quality control field "Was site snapped". Any sites in red were more than 50m away from the river network. This useful field can be used to quickly filter out invalid sites. |
|
|
The workflow above talked through the process as if the data was supplied as a CSV file in WGS84. If your data is already a spatial dataset you can skip to step 7. If your data was a spatial dataset in the same coordinate system as the river then you can skip to step 8. If your data was a CSV but the coordinates already in the same units as your river network then you can skip step 7. Which steps you skip entirely depends on what you were given. When preparing the data in Excel always remember to clean up the field headers and remove rows that have no XY locations.
|