Example - Visualise sedimentation zones upstream of in-stream barriers
Scenario
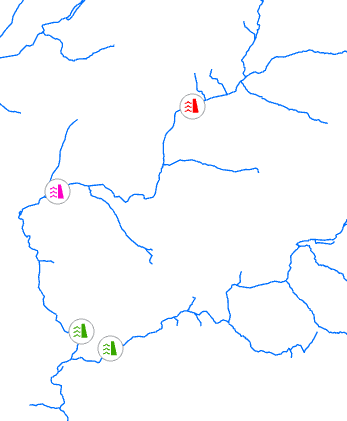
As a geomorphologist you are interested in fine sediment deposits upstream of in-channel barriers such as weirs or sluices. You have developed a formulae to calculate the extent of sedimentation based upon type of structure and permeability. You have applied this formulae to each barrier within your point dataset. You wish to visualise these impact zones in figures that you intend to include in your report.
 The following guide is using a fictitious set of points and is in no way representing known weirs/sedimentation!
Workflow
|
Step |
Processing Task |
||||||||
|
1 |
You have prepared your river network and added the required attribution to the network so you can use the Create upstream reach for site tool. How do you know which attributes you need to add to the network so this tool will function? The answer is in the help file, under the usage section. You need to have attributed your river network with Source ID. |
||||||||
|
2 |
Your barrier dataset must conform to the specifications as discussed in the limitations section of the tool. The barrier dataset should ideally be a point dataset in a File GeoDatabase. Avoid using shapefiles these are an old data format with limitations. You will have added and populated a numeric field in your barrier dataset that identifies the length in metres of the upstream sediment impact zone. |
||||||||
|
3 |
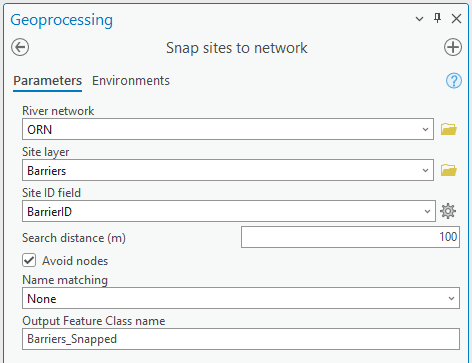
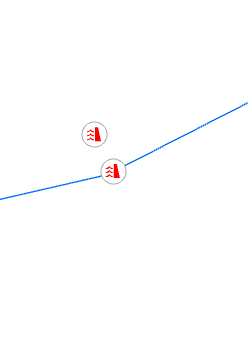
Barrier data can come from a variety of sources and they are almost always not aligned to your river network. You need to snap the points to the river networks. It will be the snapped data you will work with.
|
||||||||
|
4 |
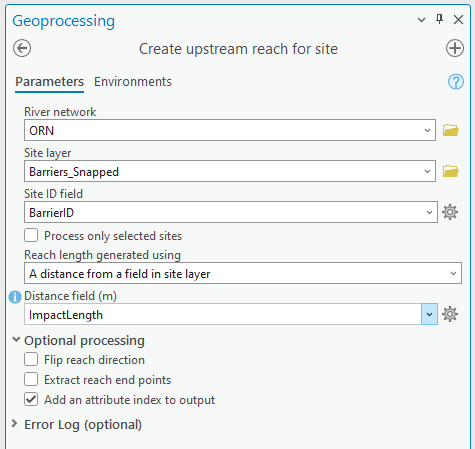
The Create upstream reach for site tool is completed as shown below, note the reach length is coming from the field ImpactLength. Output is written to the Sites GeoDatabase.
|
||||||||
|
5 |
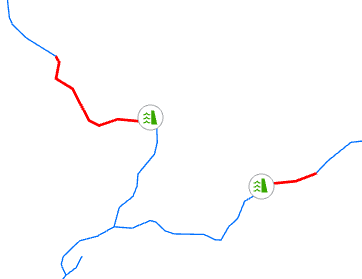
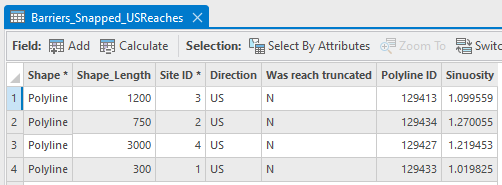
The output is automatically added to the map. Below are the computed reaches for two weirs
The reach attributes can be linked back to the barrier data by the Site ID field, more information on what the fields mean are found in the output section of the tool's help page.
|
||||||||
|
|
You have achieved your goal in visualising the impact zone. This data can be very useful in further spatial analysis as you now have a polyline that you could buffer and intersect with other spatial datasets such as riparian habitat, geology, administrative boundaries or infrastructure data. The reach and any intersecting data can be linked back to your barrier data by the Site ID field. |